The current article explains the processing order of Application Control and Web Filtering security profiles when both are applied to the same security policy.
Setting up the testing environment#
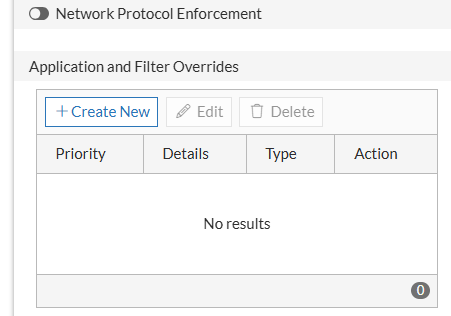
- To setup the testing environment, an Application Control profile under
Security Profiles > Application Controlis created. This AC profile will monitor all application categories but block the GitHub application, usingApplication and Filter Overrides:
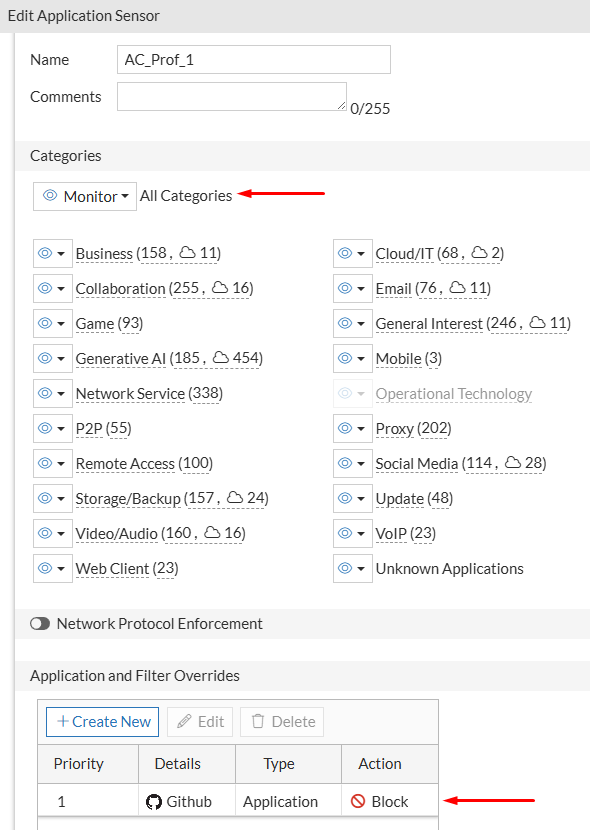
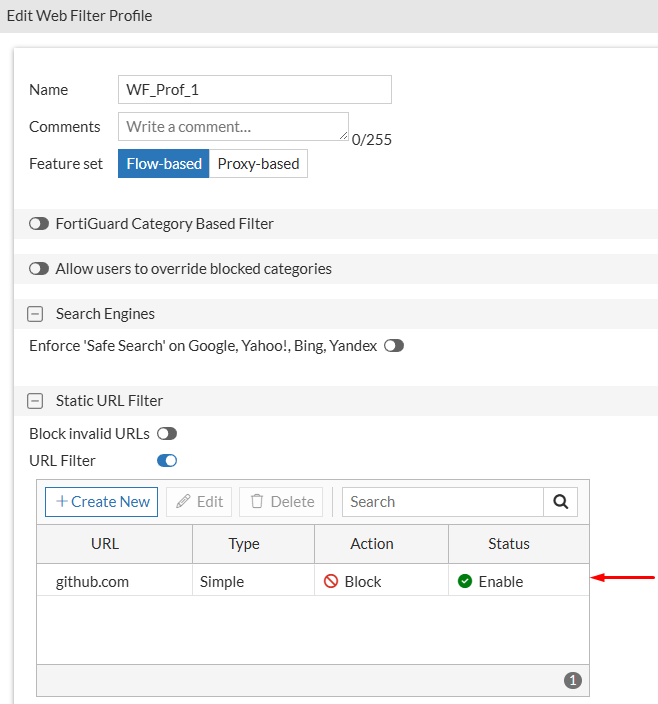
- A Web Filter profile is also created under
Security Profiles > Application Controlwheregithub.comwill be configured with theBlockaction , usingStatic URL Filter:
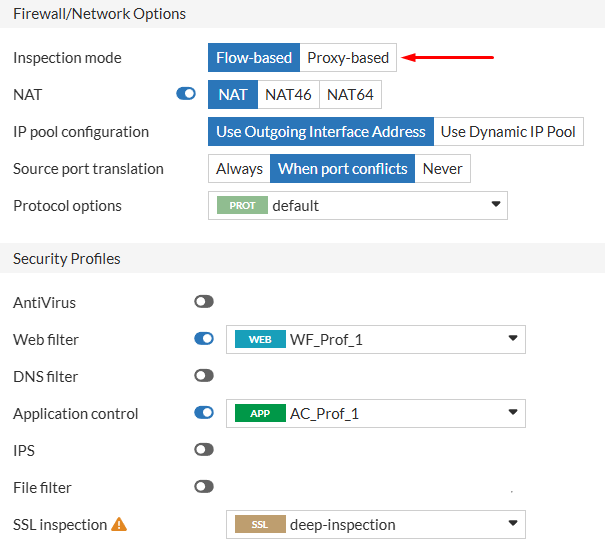
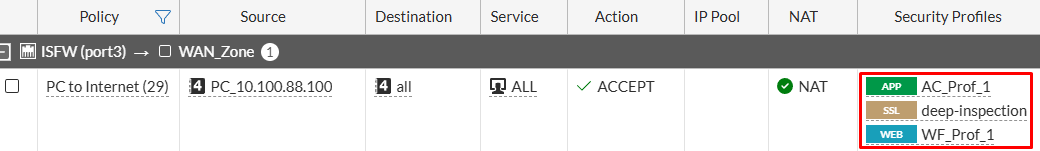
- Next, a firewall policy is created for secure internet access from a specific user PC. Both security profiles (WF, AC) created in the previous steps are applied in this policy. The inspection mode for this policy will be
Flow-based. Furthermore,deep-inspectionSSL profile is applied:
Application Control in action#
- From the user PC, access to https://github.com is tested:
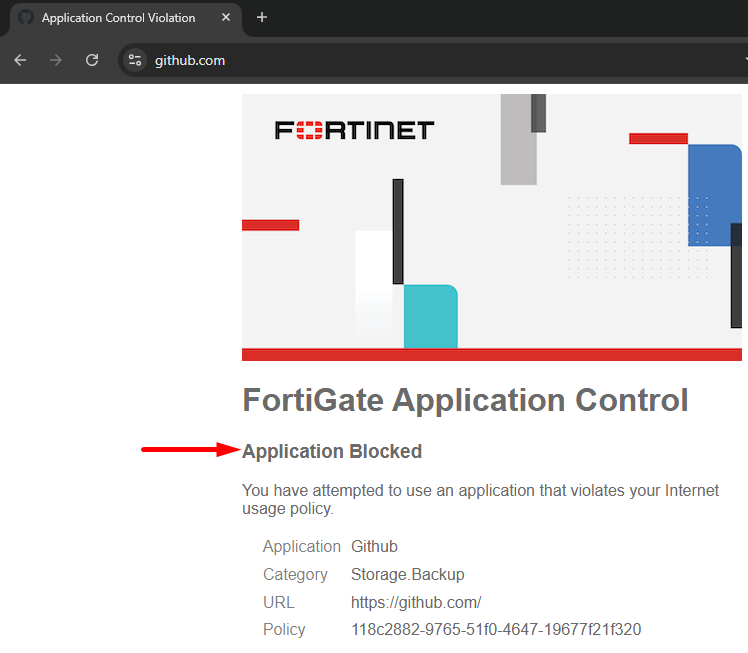
The user receives a block message from FortiGate indicating the access was blocked because of Application Control - “Application Blocked”. The user sees the blocked application name, its category, and URL.
- To check the details of this block, first take a look at the traffic logs under
Log & Report > Forward Traffic, filtering by theSourceIP address and theApplication Name:
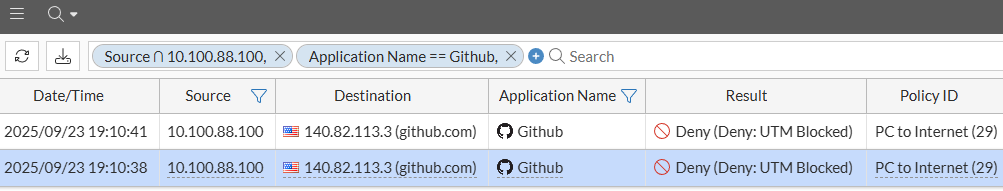
Two traffic logs from the user 3 seconds apart from each other are shown, each one with a different Session ID. Check the details of the first log.
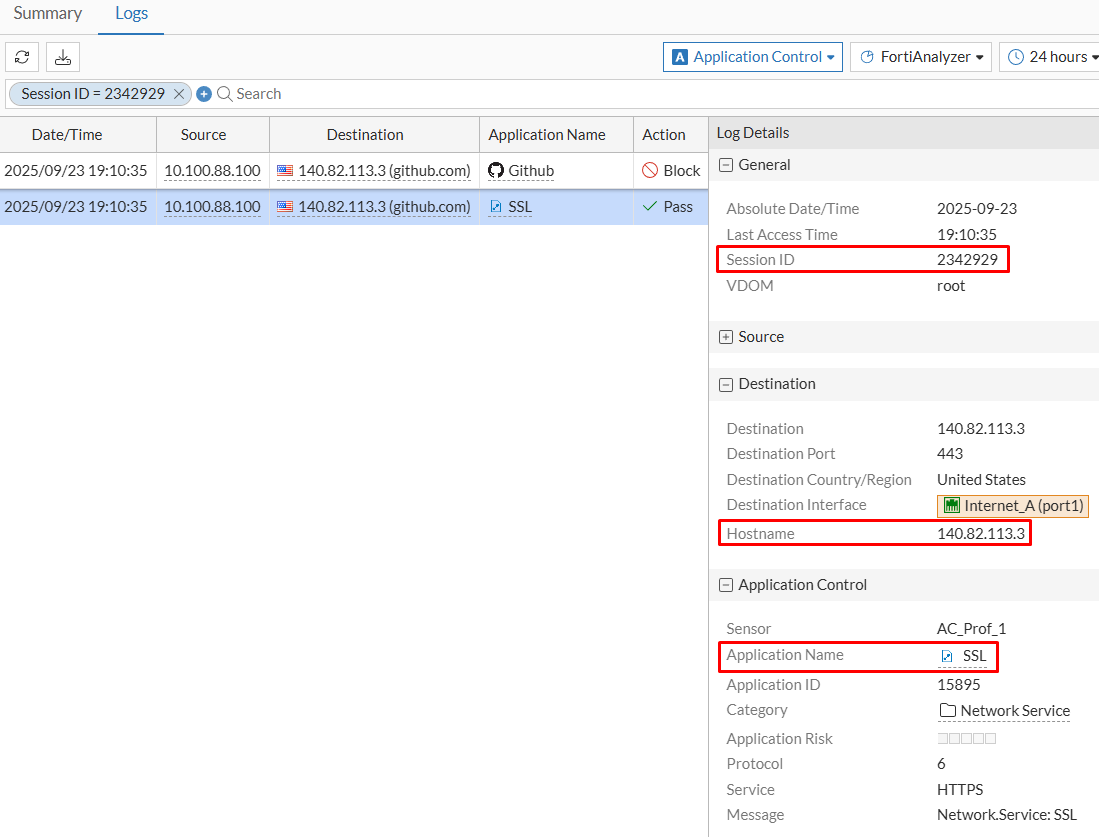
- Double click the first log to check its details:
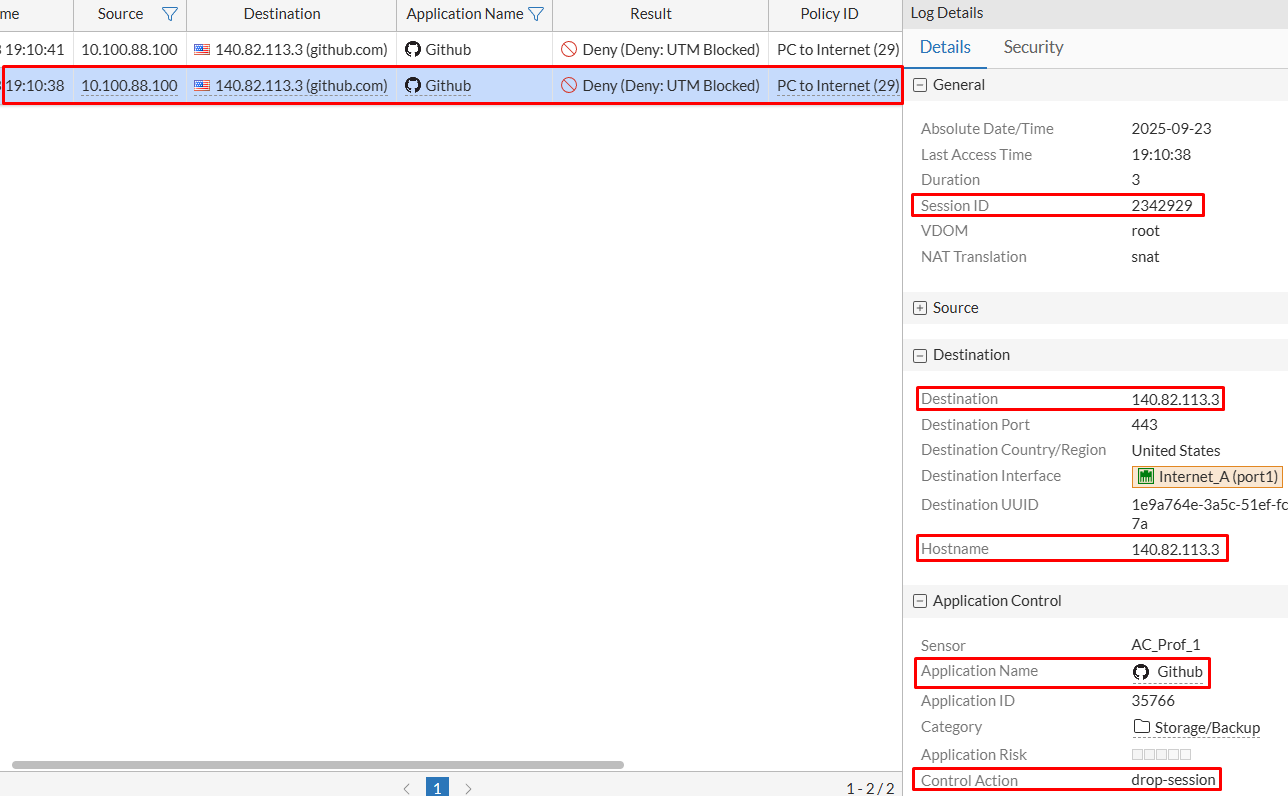
From the Details tab some information about the traffic is confirmed:
Session ID: 2342929Destination: 140.82.113.3Hostname: 140.82.113.3 (same as destination)Application Name: GithubControl Action: drop-session
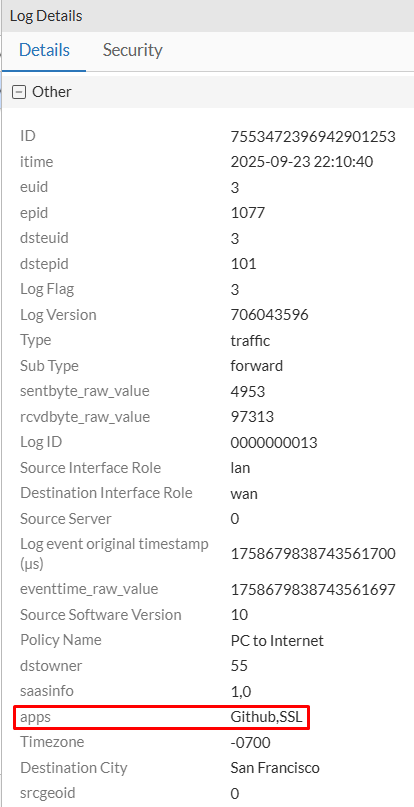
Scrolling further into the log details, an important piece of information under Other section is shown:
apps: Github, SSL
Security tab should show the application control logs related to the selected session. Clicking on the Show matching logs icon, the AC matching logs should be shown in more detail. However, in practice sometimes it doesn’t work properly and different logs of different sessions are shown.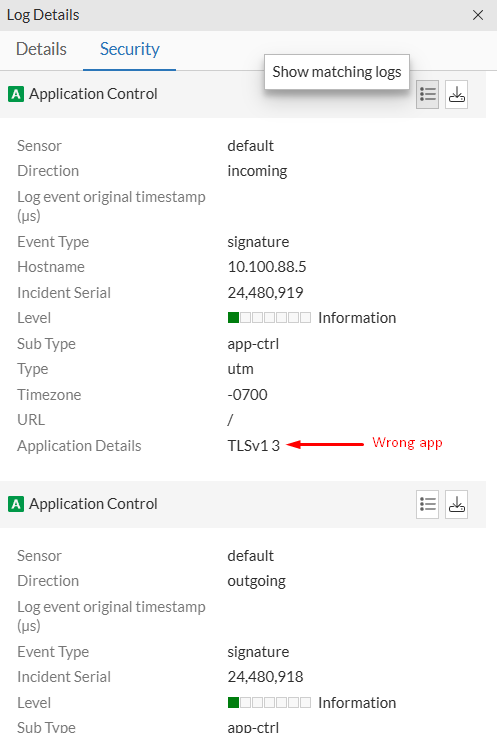
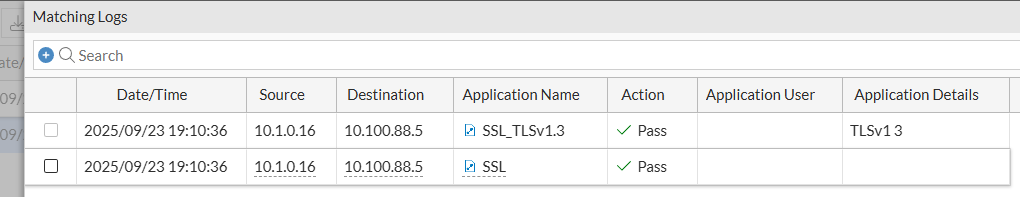
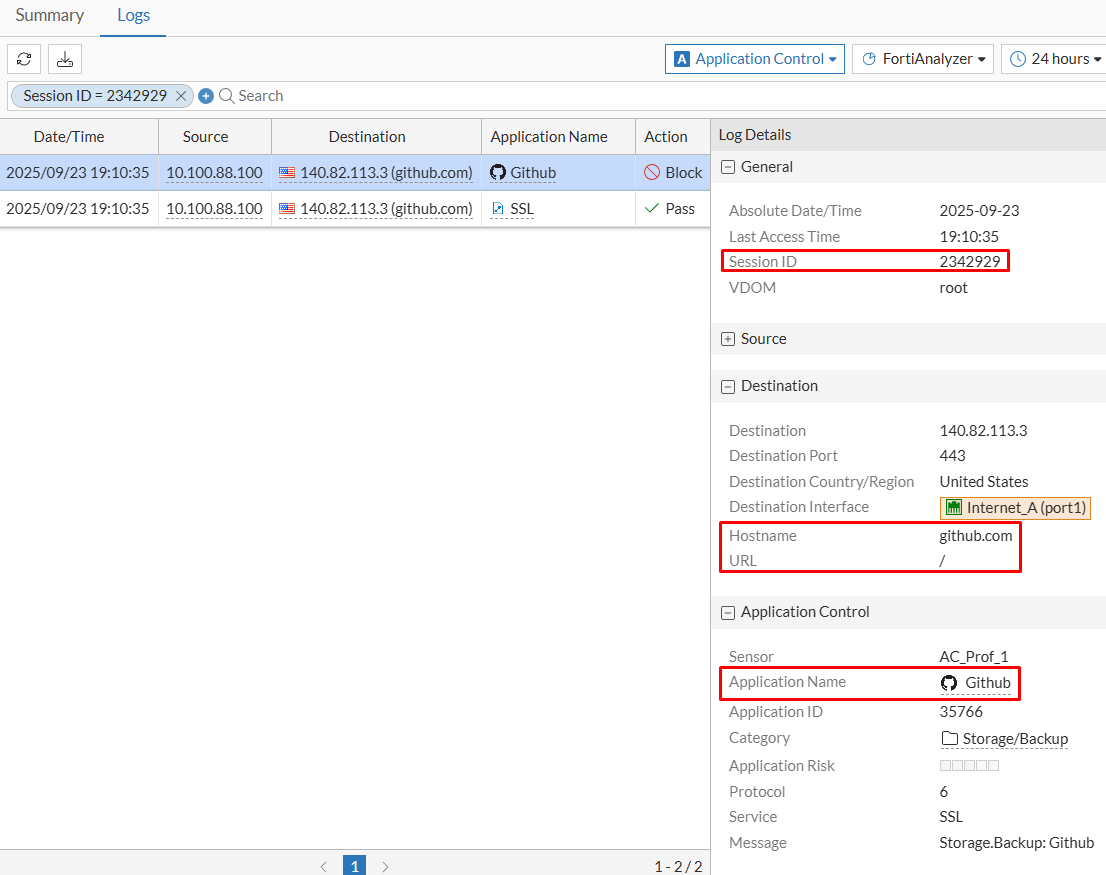
- A more trustful way of checking the application control logs is going to
Log & Report > Security Events > Application Control. Then filter by theSession ID(previously got from the traffic logs):
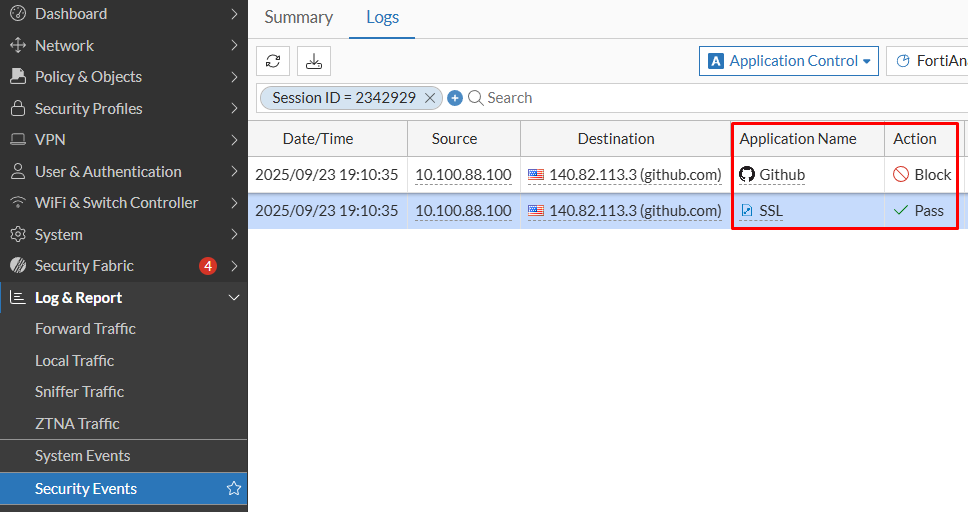
Check that both the Application and the Action values are different for both logs, although they belong to the same session ID. This is because, the application is initially recognized as SSL, which has an action of Pass (Monitor) according to the Application Control profile. Then, the application is re-identified more precisely as Github. All this happens in fraction of a second, which can be verified on Date/Time value of each log.
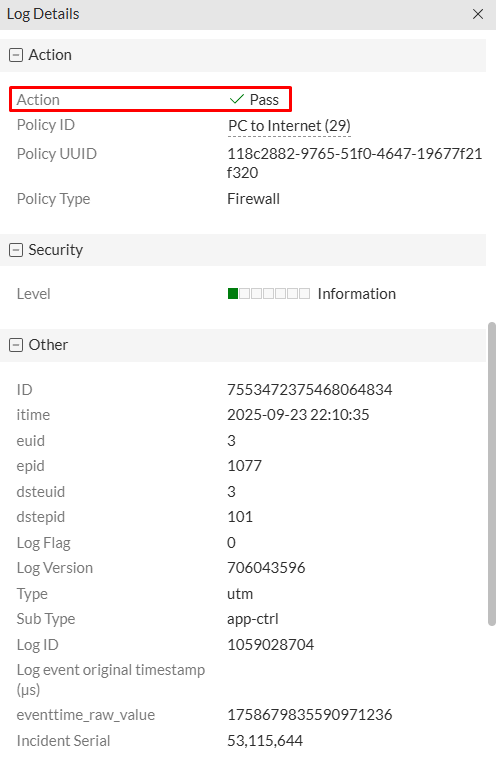
- Selecting the first application control log, the following is confirmed:
- Under
Generaltab, theSession IDmatches the traffic log - Under
Destinationtab, theHostnamematches theDestinationIP address. - Under
Application Controltab, the identified application is SSL - Under
Actiontab, the action isPass(matching the AC profile action for this app)
- Under
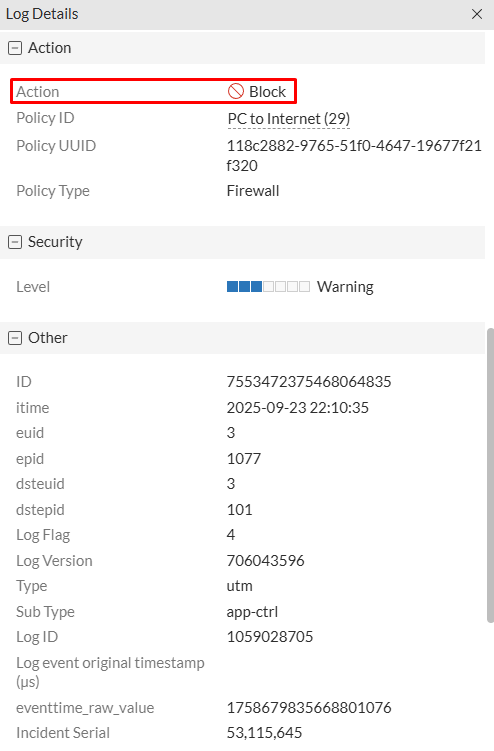
- Selecting the second application control log, the following is confirmed:
- Under
Generaltab, theSession IDmatches the traffic log (and the previous application control log) - Under
Destinationtab, theHostnamematches the visited domain together with an additional parameter -URL“/”. - Under
Application Controltab, the identified application isGithub - Under
Actiontab, the action is nowBlock(matching the AC profile action for this app)
- Under
Web Filter in action#
Because of the previous test we know that Application Control has precedence over Web Filter security profile. To confirm that Web Filter would also block the access to https://github.com , the following changes are made: 1) Remove GitHub from the Application Control Override, 2) Test user access again.
- Go To
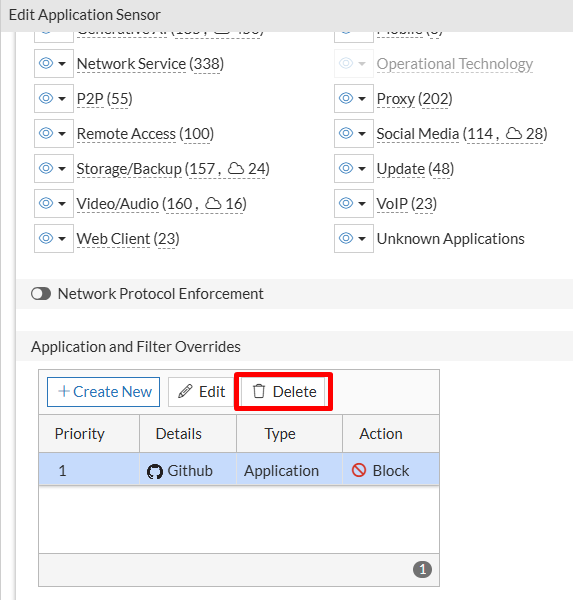
Security Profiles > Application Control, select the Application Control Profile and click onEdit. - Under
Application and Filter Overrides, selectGithuband click onDelete:
- Verify the application is deleted and click
OKto save changes:
- Try to access again to https://github.com from the user PC:
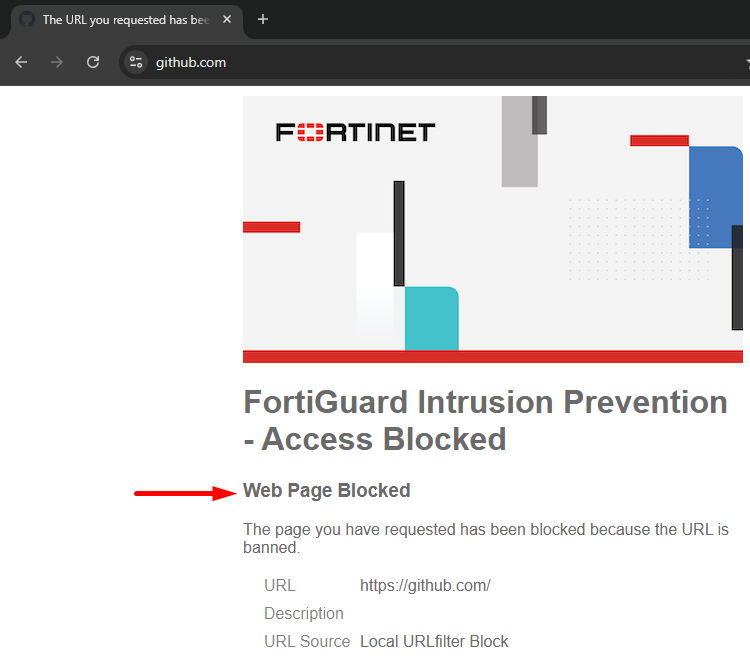
This time the user got a different blocking message related to FortiGuard Intrusion Prevention - Access Blocked - “Web Page Blocked”. The user also sees the blocked URL.
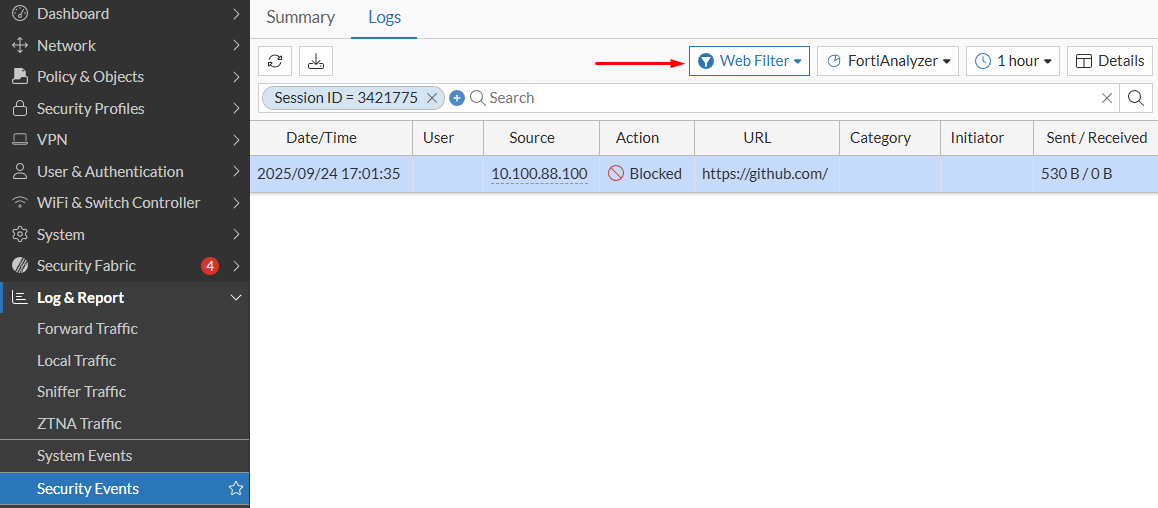
- To check the details of this block, first take a look at the traffic logs under
Log & Report > Forward Traffic, filtering by theSourceIP address,DenyasResult, and the firewallPolicy ID:
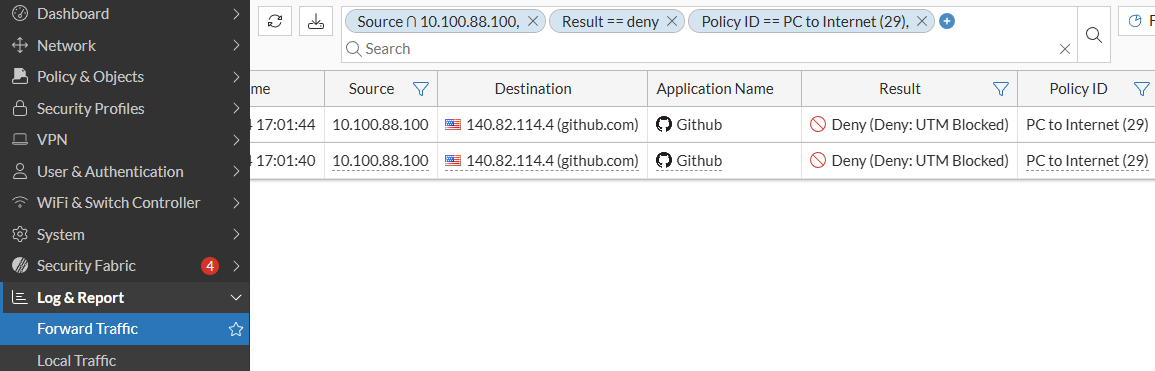
Two traffic log entries from the user, 4 seconds apart from each other are listed, each one with a different Session ID. Verify the details of the first log.
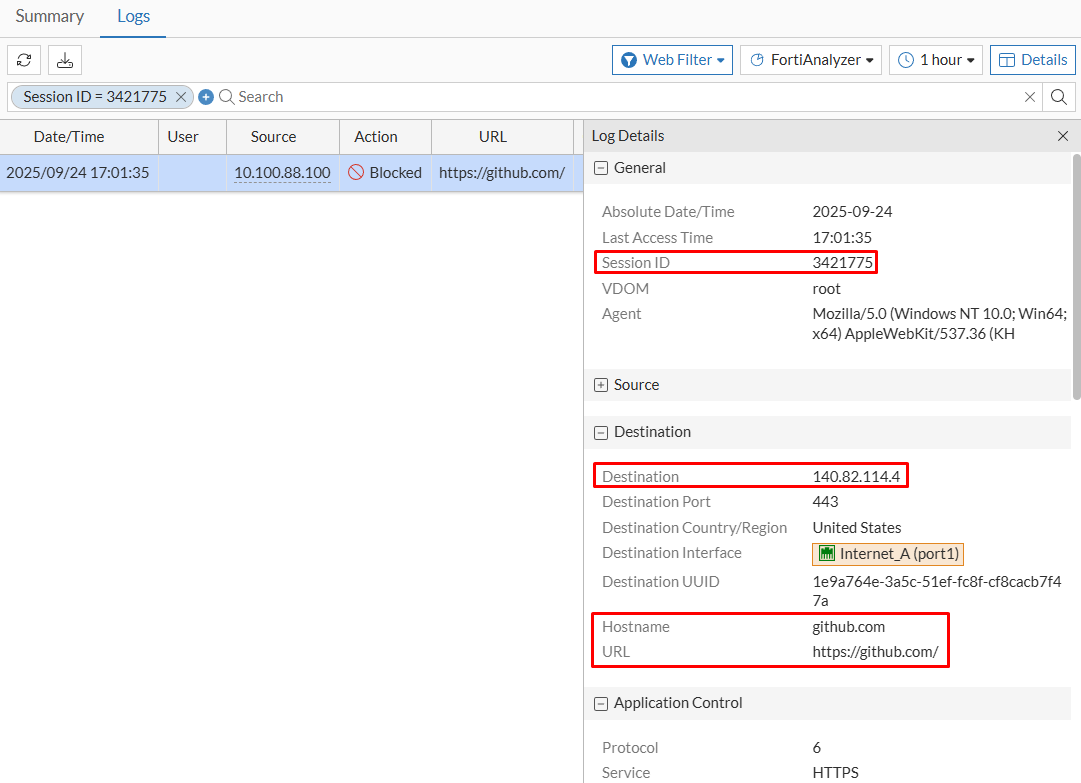
- Double click the first log to check its details:

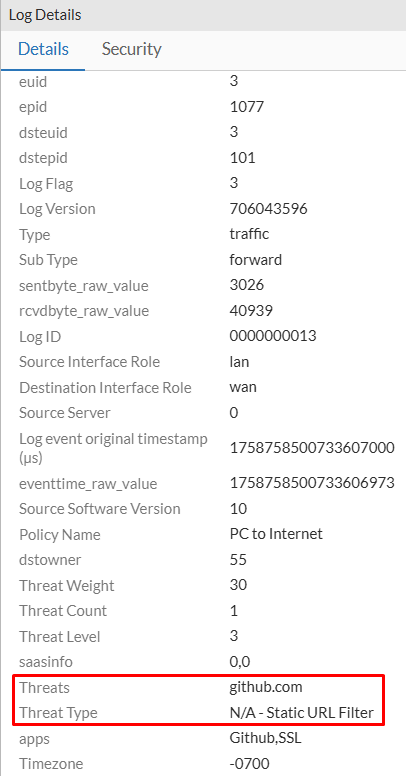
From the Details tab some information about the traffic can be reviewed:
Session ID: 3421775Destination: 140.82.114.4Hostname: 140.82.114.4 (same as destination)Application Name: GithubControl Action: detected (meaning Application Control profile didn’t block the traffic because of the identified application)
Scrolling further into the log details you can also verify an important piece of information under Other section:
Threats: github.comThreat Type: N/A - Static URL Filter
- Clicking on
Securitytab of the log details should shown as brief explanation of theWeb Filterevent. Here, information as theEvent Type,HostnameandURLrelated to this web filter event can be reviewed and you can click onShow matching logsto get more details about the security event:
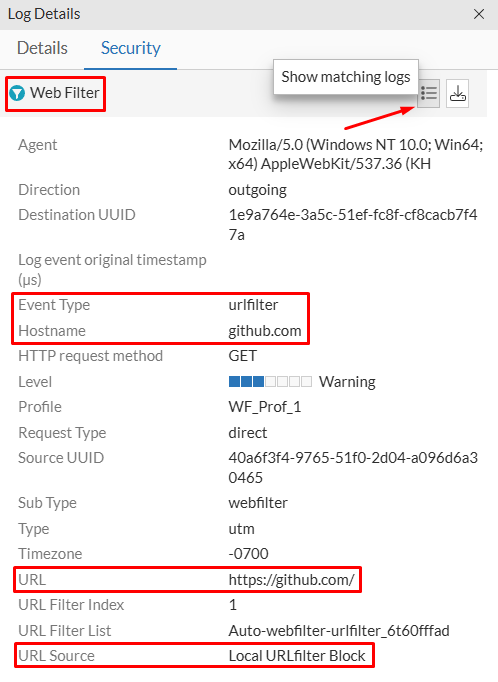
Security tab and the Show matching logs icon output really matches the investigated event. Sometimes the information may correspond to a different session. You can always go to Log & Report > Security Events as a better option.- A more trustful way of checking the application control logs is going to
Log & Report > Security Events > Web Filter. Here, filter the Session ID checked from the traffic logs:
- Double clicking on the log, more details about the security event is returned:
- Under
Generaltab, theSession IDmatches the traffic log. - Under
Destinationtab, theDestination IPaddress,Hostname, andURLare shown.
- Under
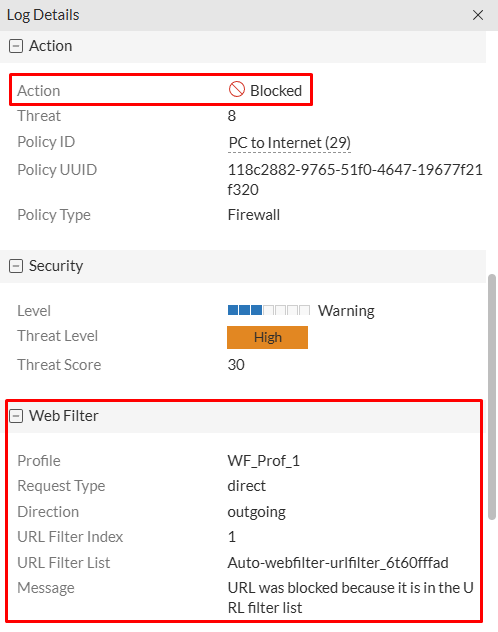
- Scrolling down further…
- Under
Actiontab, the action isBlocked - Under
Web Filterverify the information related to the web filter profile. For example theMessageindicate the reason why this URL was blocked.
- Under
Conclusion#
- In flow-based inspection mode, the firewall policy will first enforce the Application Control profile and then the Web Filter profile. So, when an application is permitted by the Application Control profile, the URL could still be blocked by the Web filter profile.
- The same tests done with proxy-based inspection mode policy and using a Proxy-based Web Filter profile provide the same processing order. First, the application control is applied and then the web filter profile.