This guide explains how to integrate FortiGate with FortiClient EMS to share endpoint information and security posture tags for ZTNA enforcement. It walks through configuring the EMS fabric connector, authorizing the connection, creating and synchronizing security posture tags, and verifying tagged endpoints across FortiGate, EMS, and FortiClient.
1. Connecting FortiGate and EMS#
FortiGate can keep endpoint device information and security posture tags updated through the communication with the EMS. For this to happen, the configuration of a fabric connector is required.
- Go to
Security Fabric > Fabric Connectors, click onFortiClient EMSand selectEdit:
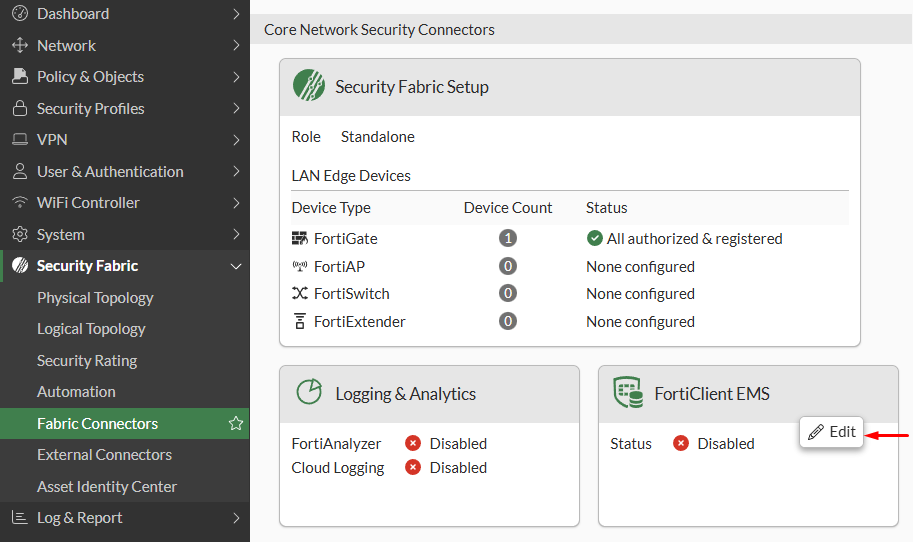
- Under
EMS1section, change theStatustoEnabled, then define the EMS properties:
Name- you can set the any name you want to identify the EMSIP/Domain nameHTTPS port
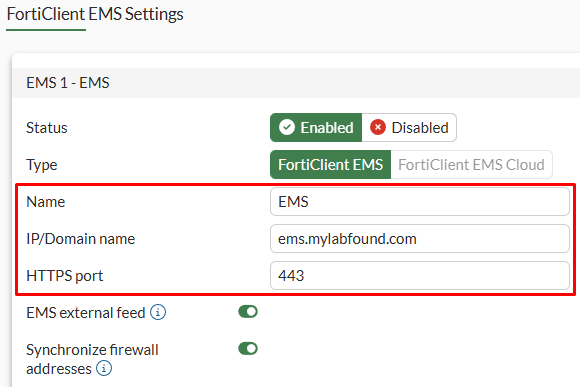
- Select
OKto apply changes.
Accept the EMS certificate presented to FortiGate that will be used for the communication with the EMS:
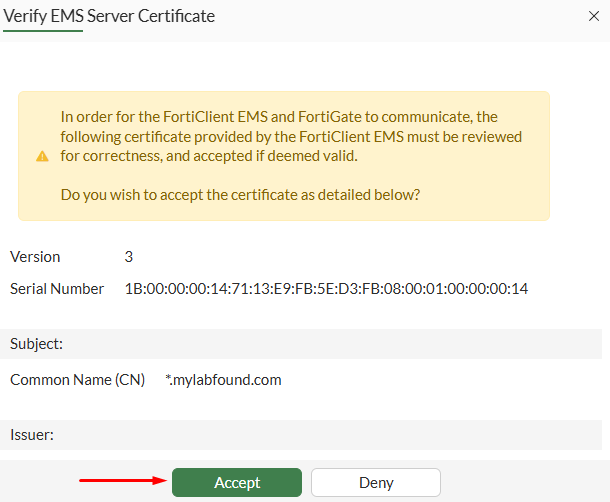
System Settings > EMS Settings using the Webserver certificate option. A different certificate can be used by first uploading one on EMS under System Settings > EMS Server Certificates.- A new pop-up window appears, select
Authorize:
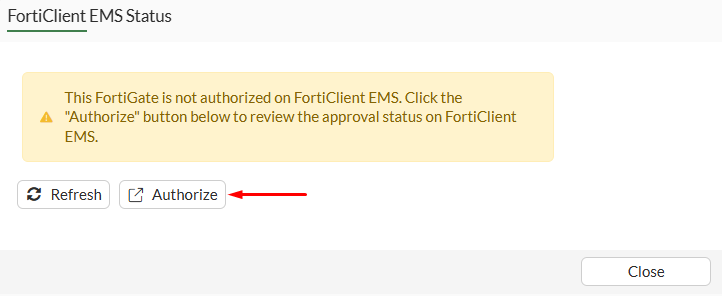
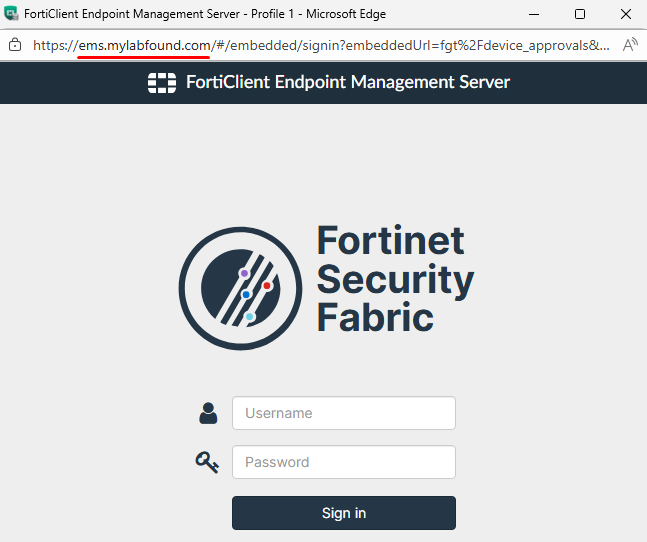
A new browser window shows up with the IP/doman and port of the EMS details previously specifying. Login using the EMS credentials:
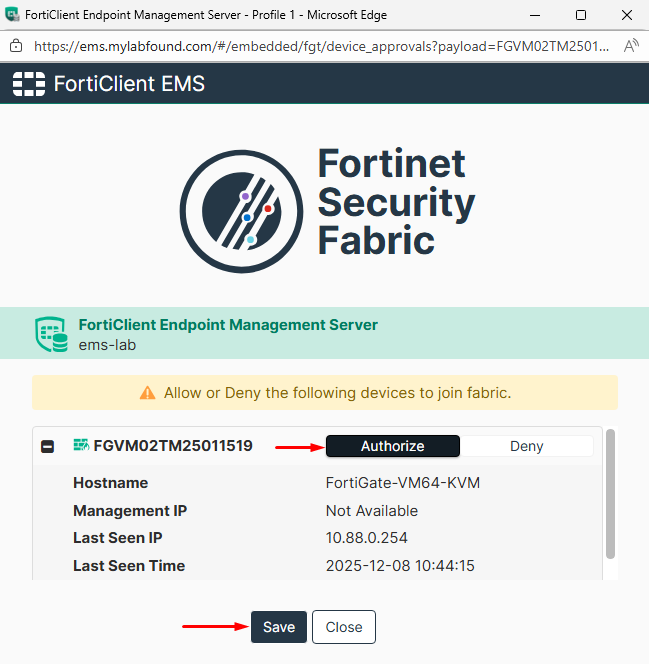
Set the status to Authorize and then click on Save:
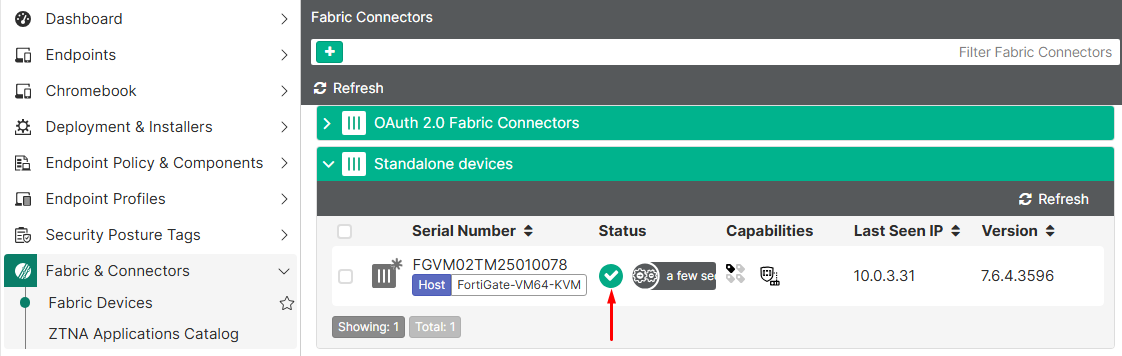
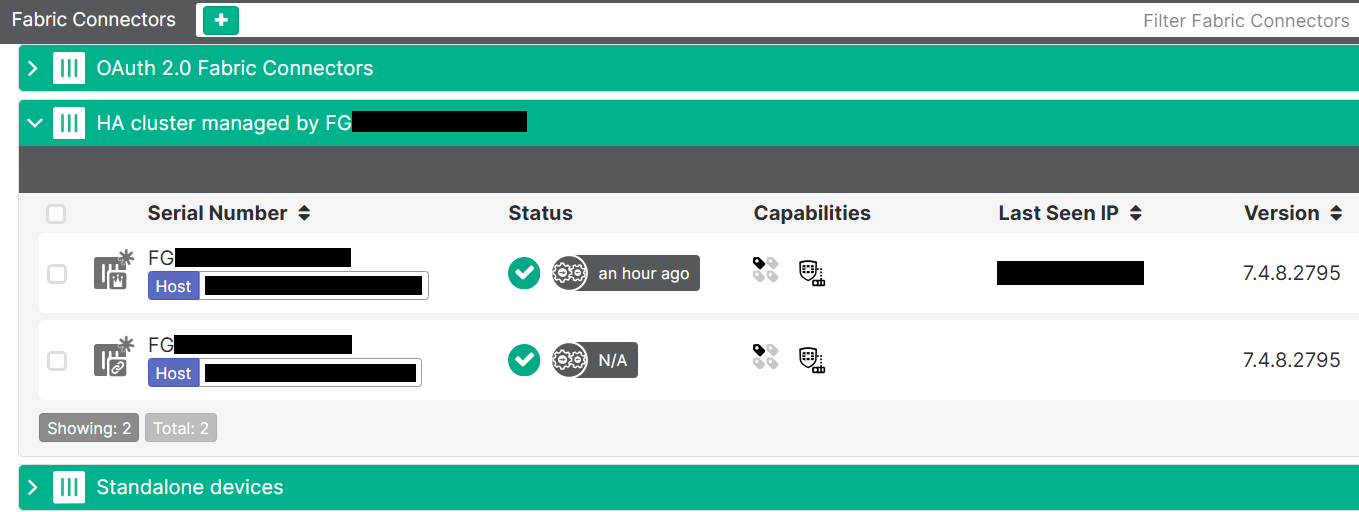
Alternatively, the FortiGate connection request can be accepted from EMS GUI console going to Fabric & Connectors > Fabric Devices:
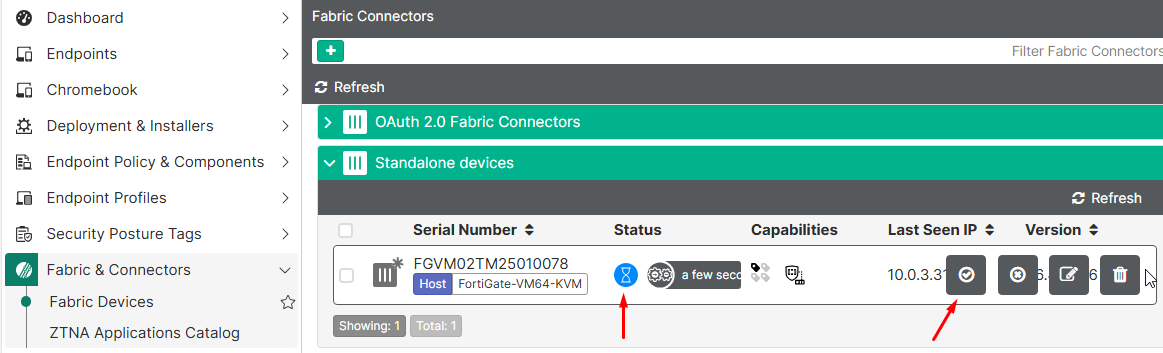
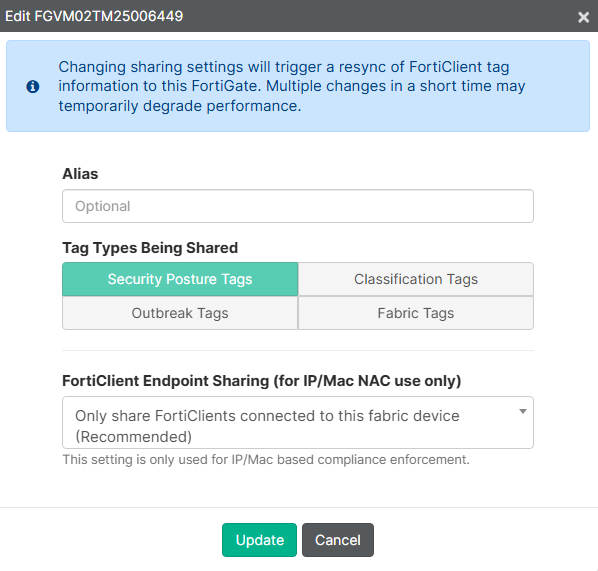
Using the Edit icon for this entry allows to define the capabilities, i.e. shared tags and FortiClient endpoint sharing. These are the default settings:
Tag Types Being Shared: Security Posture TagsFortiClient Endpoint Sharing (for IP/Mac NAC use only): Only share FortiClients connected to this fabric device (Recommended)
Check additional configuration information here: FortiClient 7.4.4 EMS Administration Guide - Fabric and also FortiClient 7.4.4 EMS Administration Guide - Matched endpoints and resolved addresses
- Back to the FortiGate window, the FortiClient EMS connector status should change to
Connected:
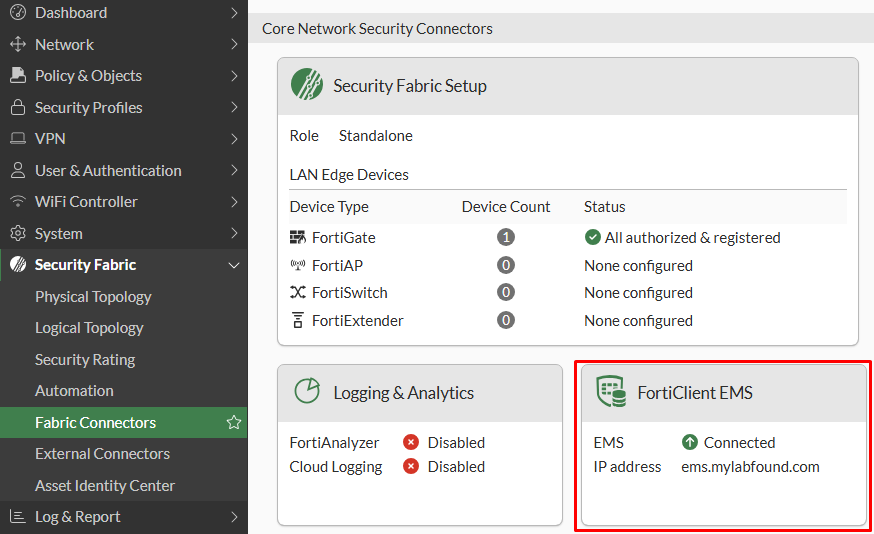
- Confirm FortiGate connectivity on EMS by going to
Fabric & Connectors > Fabric Devices. The status should have check icon:
From FortiGate CLI, some troubleshooting commands can be used to verify EMS connectivity after the connector configuration:
- Verify FortiGate - EMS connectivity:
# diag endpoint fctems test-connectivity 1
Connection test was successful.
The ID of the EMS is 1 in this example.
- Show EMS connectivity information:
# diag test application fcnacd 2
EMS context status:


FortiClient EMS number 1:
        name(id): EMS(1) confirmed: yes
        is global: true
        interface vdom: root
        fetched-serial-number: FCTEMS8825007278
        fetched-tenant-id: 00000000000000000000000000000000
        user-data:
                verified capabilities: true
                verified identity: true
        interface-selection-method: 0
        verify-peer-method: 3
        ztna-public-key:0x7f317f430d20
Websocket status: connected, oif: 0
2. Configuring Security Posture Tags#
The security posture tags provide posture checks on endpoints based on their information. This allows to enforce policies when trying to access a resource through ZTNA. These tags are shared with the connected FortiGate.
Following, some sample tags with different purposes are created. The displaying of security tags in FortiClient is activated and then the tagging is verified from both EMS and FortiClient:
Tag for Vulnerability Severity Level#
To configure a security posture tag that verifies if the endpoint has a high or critical vulnerability (detected by EMS’s Vulnerability Scan security profile) follow these steps:
- On FortiClient EMS GUI console, navigate to
Security Posture Tags > Tags:
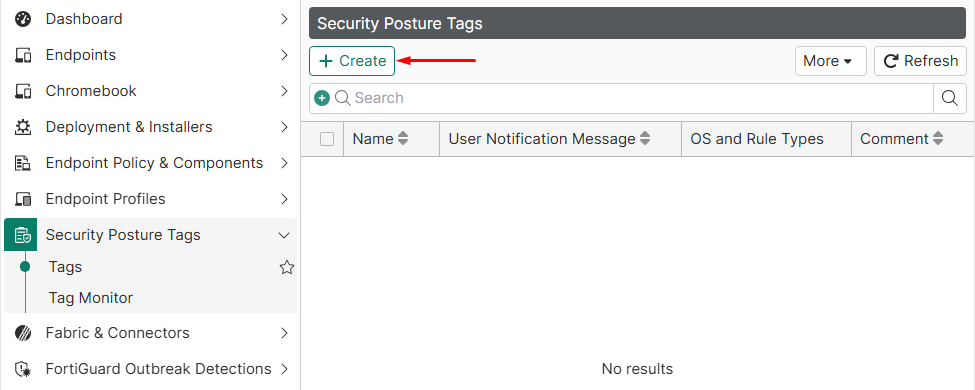
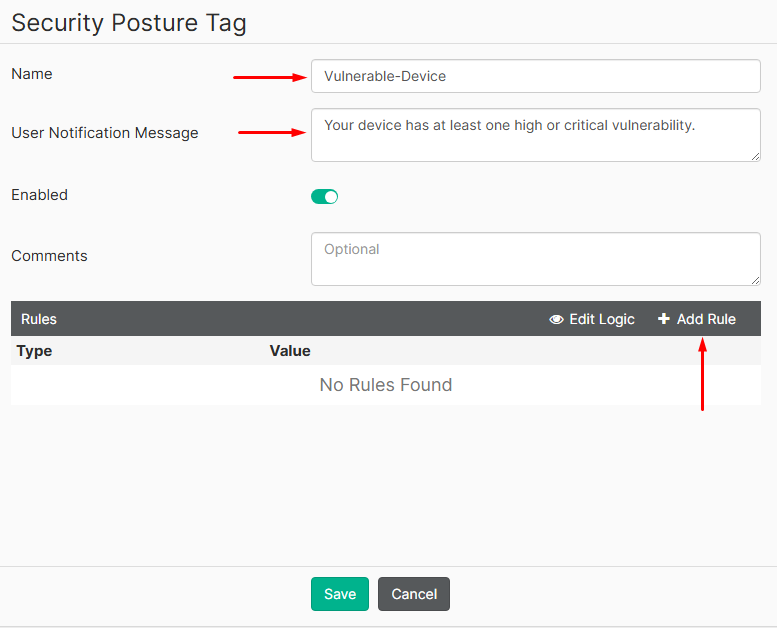
- Set a name for the tag, and a user notification message related to the tag. Then click on
Add Rule:
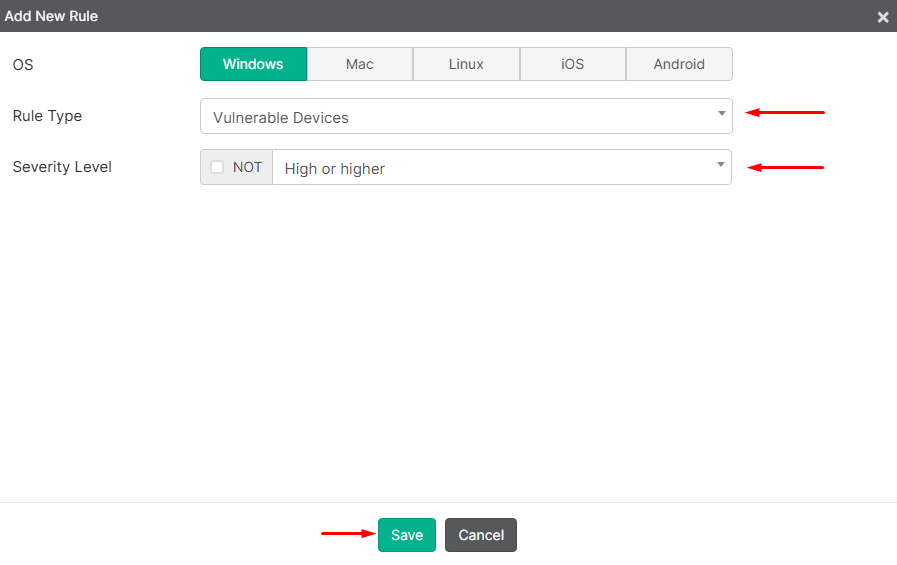
- Select the
OS(Windows in this example), then set theRule TypetoVulnerable Devicesand theSeverity LeveltoHigh or higherwhich defines the minimum vulnerability level (low/medium/high/critical) to apply the tag. Then selectSave:
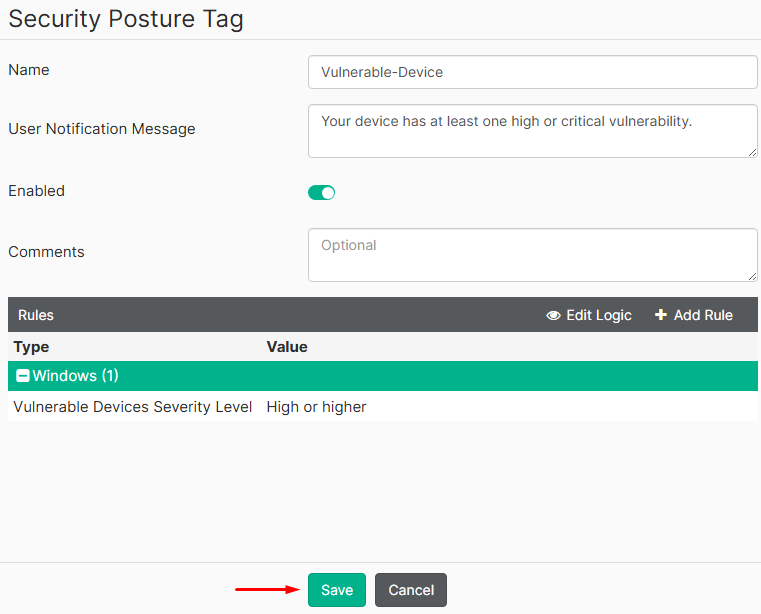
- Select
Saveone more time:
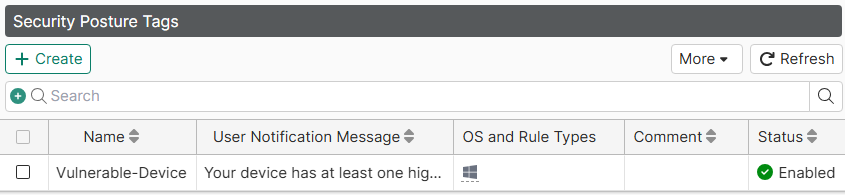
The security posture tag should now be listed:
Tag for Verifying EMS Management#
To configure a security posture tag that verifies if the the endpoint has FortiClient installed and Telemetry is connected to EMS follow these steps:
- On FortiClient EMS GUI console, navigate to
Security Posture Tags > Tags. - Set a name for the tag, and a user notification message related to the tag. Then click on
Add Rule. - Select the
OS(Windows in this example), then set theRule TypetoEMS ManagementandManagedtoFortiClient installed and Telemtry connected to EMS. Then selectSave:
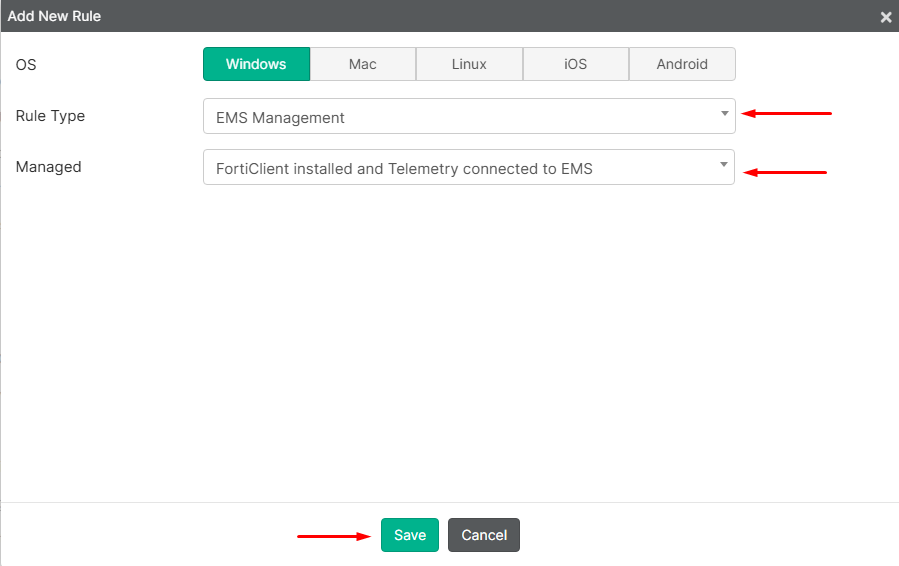
- Select
Saveone more time:
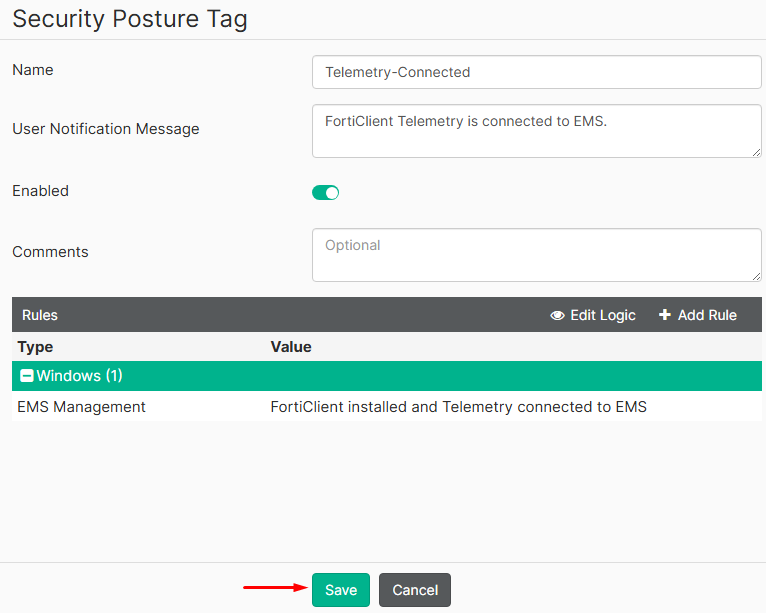
The security posture tag should now be listed:

Configure the Displaying of Security Posture tags in FortiClient#
For troubleshooting purposes it is recommended to display the Security Posture tags in FortiClient interface. This is enabled on a per-profile basis. To enable that follow this procedure:
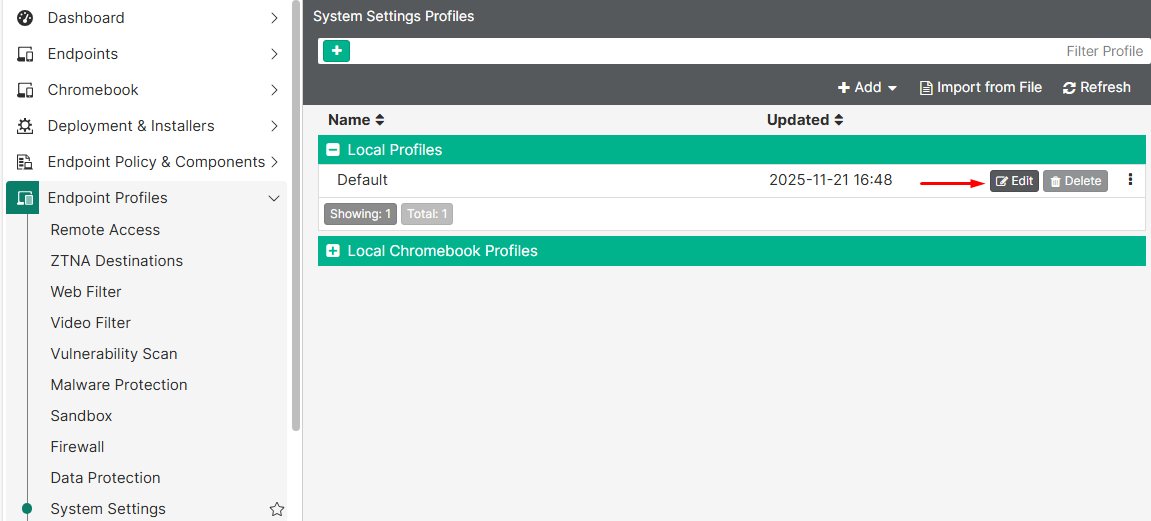
- Go to
Endpoint Profiles > System settings, andEditthe desired profile:
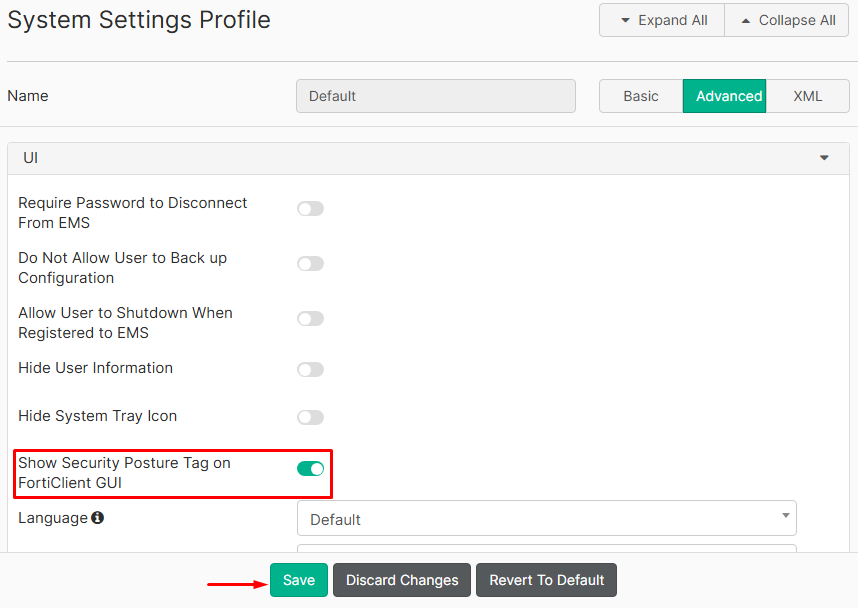
- With
Advancedvisibility, enable theShow Security Posture Tag on FortiClient GUIoption, then selectSave:
Verifying Security Posture Tagging#
The Security Posture Tagging on endpoints can be reviewed from multiple places:
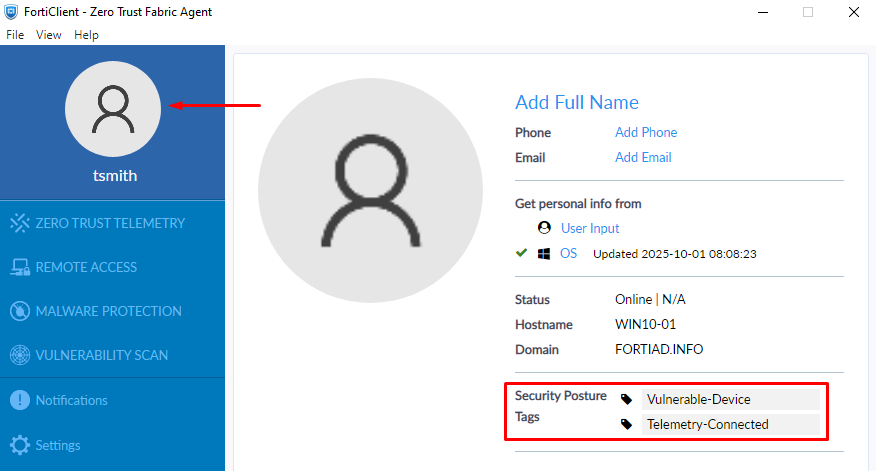
- From the FortiClient GUI:
Select the user icon, the security posture tags are listed:
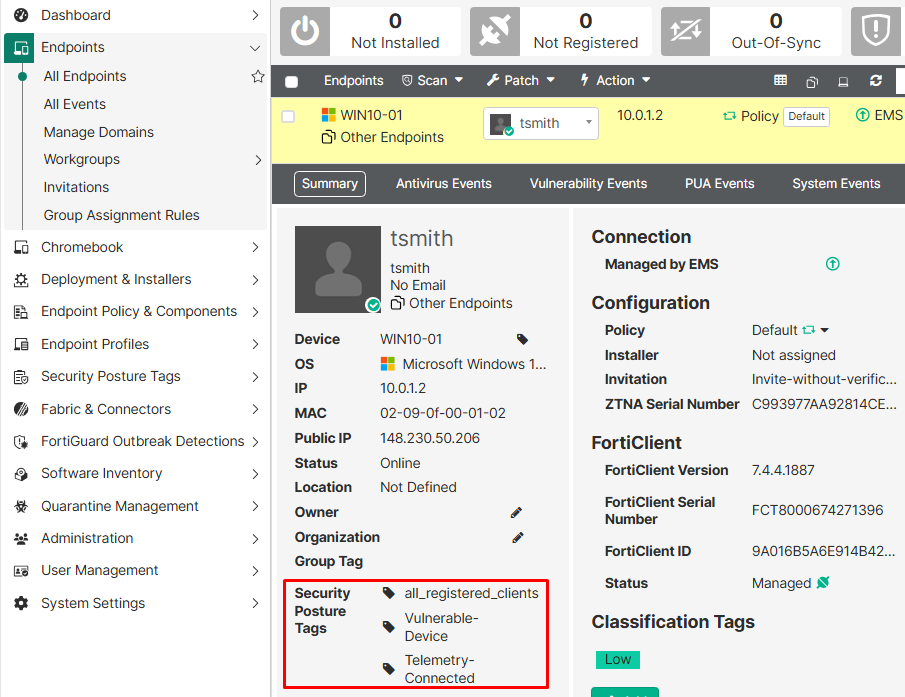
- From the EMS, go to
Endpoints > All Endpointsclick on the desired endpoint and search for theSecurity Posture Tagsproperty:
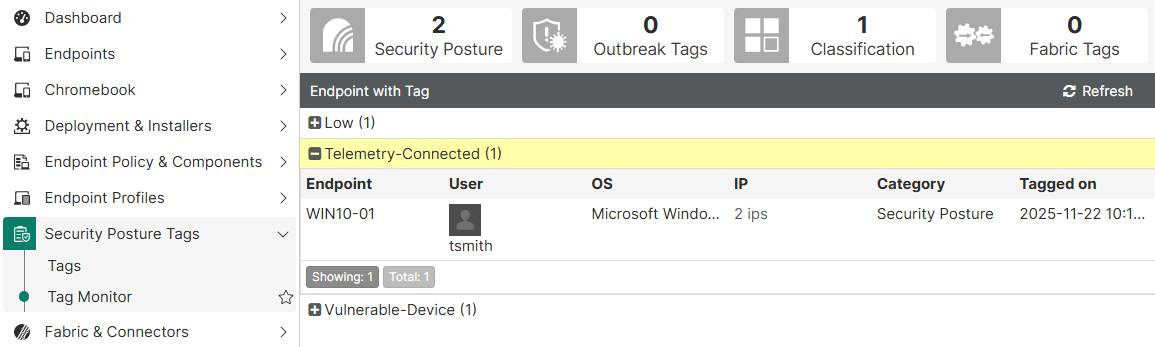
- From the EMS, go to
Security Posture Tags > Tag Monitor. Here you can check the list of endpoints for each tag:
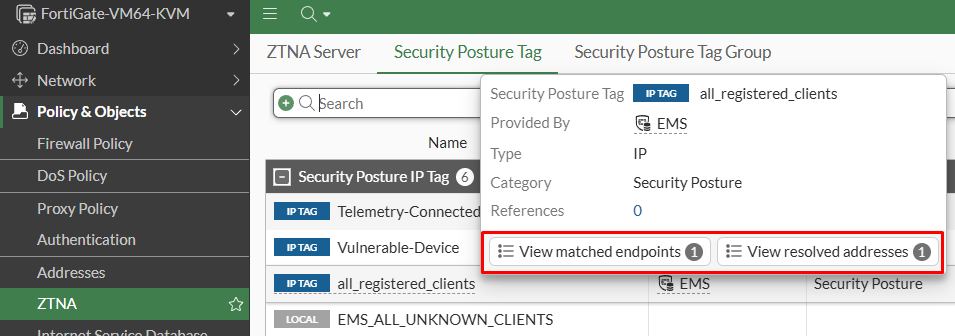
- From FortiGate GUI/CLI. On GUI, go to
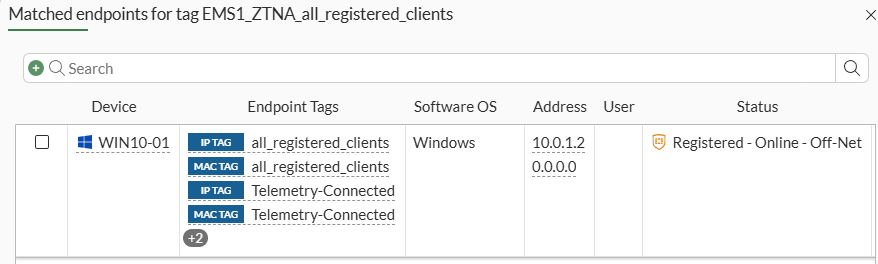
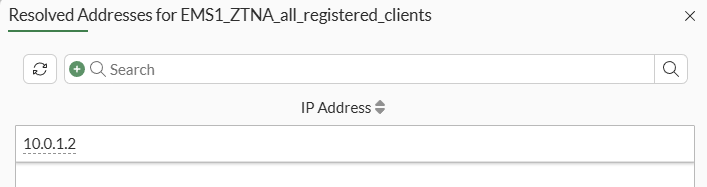
Policy & Objects > ZTNA > Security Posture Tag. Hover over the desired tag and two different options are available:
View matched endpoints(equivalent command on CLI:diagnose endpoint ec-shm list)View resolved addresses(equivalent command on CLI:diagnose firewall dynamic list)
The endpoint information shown on FortiGate, including the assigned tags depends on some factors.
According to Technical Tip: Understanding When FortiGate Displays Endpoint Information under ZTNA-Matched Endpoints and Resolved IP Address Fields in the GUI and CLI, an endpoint may be listed under both View matched endpoints and View resolved addresses lists, one of them, or neither of them. This depends if the endpoints is using the FortiGate as gateway, or connected via SSL-VPN, or connected to a downstream FortiGate in the security fabric.
Also check when an endpoint is present on each list in the following documentation: FortiClient 7.4.4 EMS Administration Guide - Matched endpoints and resolved addresses. “When FortiClient performs ZTNA connection, Resolved addresses is not populated with the endpoint’s IP or MAC address. Matched endpoints is populated with the endpoint’s information when FortiClient performs ZTNA connection.”
View matched endpointsoutput example:
Equivalent CLI command output:
# diagnose endpoint ec-shm list
Record #0:
	IP Address = 10.0.1.2
	MAC Address = 02:09:0f:00:01:02
	MAC list =
	VDOM = root (0)
	TOKEN VDOM =  (-1)
	EMS serial number: FCTEMS8825007278
	EMS tenant id: 00000000000000000000000000000000
	Client cert SN: 1D3D0710258CF569961291DF259F6333B9540EF9
	Public IP address: 148.230.50.82
	Quarantined: no
	Online status: online
	Registration status: registered
	On-net status: off-net
	Gateway Interface: port1
	FortiClient version: 7.4.4
	AVDB version: 1.0
	FortiClient app signature version: 35.125
	FortiClient vulnerability scan engine version: 3.11
	FortiClient UID: 9A016B5A6E914B42AD4168C066EB04CA
	Host Name: WIN10-01
	OS Type: WIN64
	OS Version: Microsoft Windows 10 Professional Edition, 64-bit (build 19045)
	Host Description:
	Domain: fortiad.info
	Last Login User: tsmith
	Owner:
	Host Model: Standard PC (i440FX + PIIX, 1996)
	Host Manufacturer: QEMU
	CPU Model: Intel Xeon Processor (SapphireRapids)
	Memory Size: 8191
	AV Feature: 1
	FW Feature: 1
	WF Feature: 1
	AS Feature: 0
	VS Feature: 1
	VN Feature: 1
	Last vul message received time: Wed Nov 26 16:43:21 2025
	Last vul scanned time: Wed Nov 26 23:31:44 2025
	Last vul statistic: critical=2, high=63, medium=31, low=2, info=0
	Avatar fingerprint:
	Avatar source username:
	Avatar source email:
	Avatar source: OS
	Phone number:
	Number of Routes: (1)
			Gateway Route #0:
					- IP:10.0.1.2, MAC: 02:09:0f:00:01:02, VPN: no
					- Interface:port1, VDOM:root (0), SN: FGVM02TM25006449
View resolved addressesoutput example:
Equivalent CLI command output:
# diagnose firewall dynamic list

...
CMDB name: EMS1_ZTNA_all_registered_clients
TAG name: all_registered_clients
EMS1_ZTNA_all_registered_clients: ID(70)
        ADDR(10.0.1.2)  <-----------------------------------
Total IP dynamic range blocks: 0.
Total IP dynamic addresses: 1.

CMDB name: EMS1_ZTNA_Vulnerable-Device
TAG name: Vulnerable-Device
EMS1_ZTNA_Vulnerable-Device: ID(311)
        ADDR(10.0.1.2)  <-----------------------------------
Total IP dynamic range blocks: 0.
Total IP dynamic addresses: 1.

CMDB name: EMS1_ZTNA_Telemetry-Connected
TAG name: Telemetry-Connected
EMS1_ZTNA_Telemetry-Connected: ID(495)
        ADDR(10.0.1.2)  <-----------------------------------
Total IP dynamic range blocks: 0.
Total IP dynamic addresses: 1.
...